The Carbon Laffer Curve

“the art of taxation consists in so plucking the goose as to procure the largest quantity of feathers with the least possible amount of hissing.”
-Jean-Baptiste Colbert, Louis XIV’s finance minister
It’s easy to forget amid the day to day noise around carbon markets, but at their heart, emissions trading schemes are an important, albeit still a relatively small, source of revenue for governments.
Emission allowances are initially distributed into the market via auctions before they are then traded on the secondary market. The revenues generated from auctions are either used to fund investment in carbon abatement, recycled in some way back to households and businesses, or used for general taxation, or some combination of the above.
Total carbon pricing revenues exceeded $100 billion for the first time in 2023, according to data compiled by the World Bank. Emission trading schemes (ETS) accounted for over 70% of the revenue generated (of which the EU ETS dominates), supported by the large share of emissions covered by cap-and-trade schemes, and the relatively high carbon prices achieved (see It's the carbon price, stupid!).
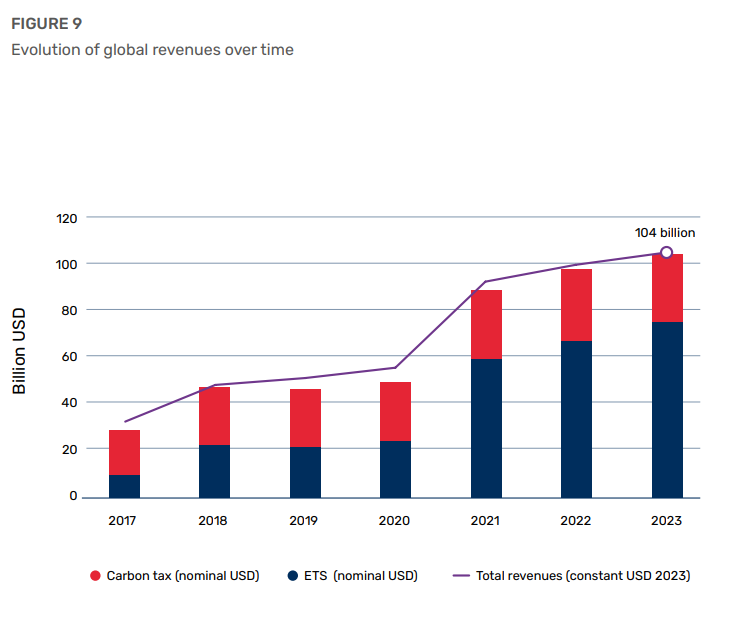
Overall, carbon price revenue (including ETS and taxes) is likely to have declined in 2024, as carbon prices typically fell between 2023 and 2024. Any decline is likely to be short-lived however. The phase-out of free allowances in the EU ETS between 2026 and 2034, the inclusion of other sectors of the economy (e.g., maritime), the launch of other ETS’ (e.g., ETS2, Indonesia, Brazil, etc.), and the expansion of other carbon markets (e.g., China’s ETS), looks set to increase global carbon pricing revenues.
Carbon pricing is an alternative source of tax revenue, one that is especially attractive for governments with yawning budget deficits. Once reliable sources of tax revenue - fuel excise and tobacco duties - are in decline as motorists shift to electric vehicles and people give up smoking. Taxing gambling and marijuana (where they are legal) are new sin taxes that have helped plug the gap. The launch of the EU’s CBAM is likely to focus many governments attention (as it has for Indonesia and Brazil, among others), on the potential tax revenue foregone to Brussel’s coffers if they don’t start pricing carbon.
Finally, while Donald Trump’s return to the White House is widely expected to have a negative impact on climate policy ambition at a macro level, it could have a positive knock-on impacts on individual US states. It will be incumbent upon those states considered to be ‘Climate Leaders’ and for which there is positive climate policy momentum, to step up and deliver an ambitious climate policies that can also generate revenue. Carbon pricing, and more specifically so-called “Cap-and-Invest” programs, fit the bill (see What's in a [carbon market] name? Why governments should adopt the 'Cap-and-Invest' nomenclature).1
Government directed carbon prices
Although an ETS should involve setting an emissions cap and then just letting the market decide the price, the reality is that governments and other institutions have several levers by which they can, and often do use, to influence the carbon price.
These include formal mechanised processes such as auction floor and ceiling prices and price containment trigger levels. It also includes informal, ad-hoc market interference involving policymakers commenting on ‘politically acceptable’ price levels or front-loading future auction supplies.
Either way, the idea of the right carbon price - ‘not too hot, not too cold’ - is never too far removed from the minds of politicians worried whether they will still be in office after the next election.
While the social cost of carbon (SCC), the marginal abatement cost, and the Precautionary Principle are important considerations in determining the ‘right price’ of carbon, governments must also consider the impact it has on revenue generation (see Pricing carbon at its social cost: Carbon markets will increasingly be influenced by the social cost of carbon).
The taxation tightrope
The standard economic way of thinking about whether a tax is set at the right level to maximise revenue is the Laffer Curve.
The Laffer Curve depicts the relationship between a country’s tax rate and the total amount of tax collected by the government. The bell-curve analysis was developed by the American economist Arthur Laffer in 1974. It was hugely influential in the supply-side economics of the 1980s, and helped support the case for large tax cuts under the Ronald Reagan administration.
The Laffer Curve suggests that there is an optimal tax rate somewhere between 0% and 100% that maximises total tax revenue. Seems obvious right? At 0% there would be no tax revenue, while at 100% economic activity would either quickly come to a standstill, or it would force people to evade taxes anyway they could.
The challenge is finding that sweet spot.
Above a certain tax rate workers would be disincentivised to work harder and have less disposable income to spend, reducing income and sales taxes. Meanwhile, for businesses, too high a tax rate would mean less investment and could result in them relocating to another jurisdiction that offered lower taxation. In short, it means less tax revenue for the government.
The Laffer curve tends to be different from one country to another due to differences in the structure of economies, including the relative share of GDP spent on labour. Meanwhile, the shape of the curve, along with the optimal tax rate, changes over time as that structure evolves. Where governments decide to set taxes versus the Laffer Curve is a ultimately political decision.
For example, a study published in 2017 from Timbro, a Swedish think tank, estimated income tax Laffer curves for 27 OECD countries. Estimates for the peak of the Laffer curve ranged from as low as 60% in the Netherlands to 76% in the US. Only five countries in the sample had a top rate of income tax that was higher than the optimal rate that would maximise tax revenue, most were at or significantly below - notably the US.2
The carbon price sweet spot
Revenue generated via a carbon price is also likely to exhibit a bell-curve relationship similar to that suggested by the Laffer Curve.
A higher EU carbon price increases the incentive to move towards less carbon intensive products and production methods. However, since lower incomes tend to spend a higher proportion of their income on energy, high carbon prices can have negative distributional effects.
A rapid increase in prices tends to have a regressive effect, in turn hampering public support for carbon pricing and even climate policies more broadly. Moreover, too high a carbon price might even end up curbing households and firms ability to switch to less carbon intensive technologies (see Europe must learn from Canada's 'price on pollution' debacle).
If the carbon price moves too far beyond the optimal rate, revenues will begin to decline, reducing the funds available that could be recycled back to those most affected by the carbon price.
A recently published study provides an empirical analysis of the relationship between EU ETS auction price and volumes and the corresponding revenue available to individual countries within the EU ETS. Analysing data covering the period Q1-2012 and Q4-2021, the researchers discovered that ETS revenues also follow a bell-curve, estimating that an optimal carbon price range on the Carbon Laffer Curve (CLC) exists somewhere between €86 and €125 per EU emission allowance (EUA).3
€100
Intuitively that makes sense, at least based on what we saw during 2022 and into early 2023. €100 proved to be an especially sensitive round number for Europe’s climate politicians.
As the EU carbon price approached this level, MEP Peter Liese, the lead lawmaker at the time in charge of EU ETS reform, was always very quick to put a pin in the markets exuberance. Most notably in February 2023 drawing attention to the intentional price dampening impact of the REPowerEU financing (see Out of ammunition: What can the EU do to stop carbon prices surging over €100?).
Moreover, Jos Delbeke, a key architect of the EU ETS and currently professor at the European University Institute in Florence has argued that the EU carbon price should remain “within the range of 60-90 euros, without much volatility outside this range.” It seems Europe’s policymakers are well aware that there is a sweet spot for carbon.
The upshot is that if governments want carbon markets to continue to support the move towards net zero - something that will require significantly higher carbon prices - then they will need to source additional funds to offset the adverse impact on those households and firms least able to adjust.
To paraphrase Monsieur Colbert, the art of carbon pricing consists of plucking the economy as to procure the largest amount of tax revenue with the least possible amount of hissing. The Carbon Laffer Curve helps show us the way.
 Peter Sainsbury
The term "Cap-and-Invest” was coined by Former Washington state Senator, Reuven Carlyle in 2019. The states ETS was launched in 2023 and called the Washington State "Cap-and-Invest" program. ↩
https://www.econstor.eu/bitstream/10419/197646/1/1007192151.pdf ↩
https://fsr.eui.eu/emission-trading-systems-their-fiscal-progressivity-and-its-limits/ ↩