All in
Investment funds race to stack EUA futures as price breakout looms


“In economics things take longer to happen than you think they will, and then they happen faster than you thought they could.” – Rudiger Dornbusch
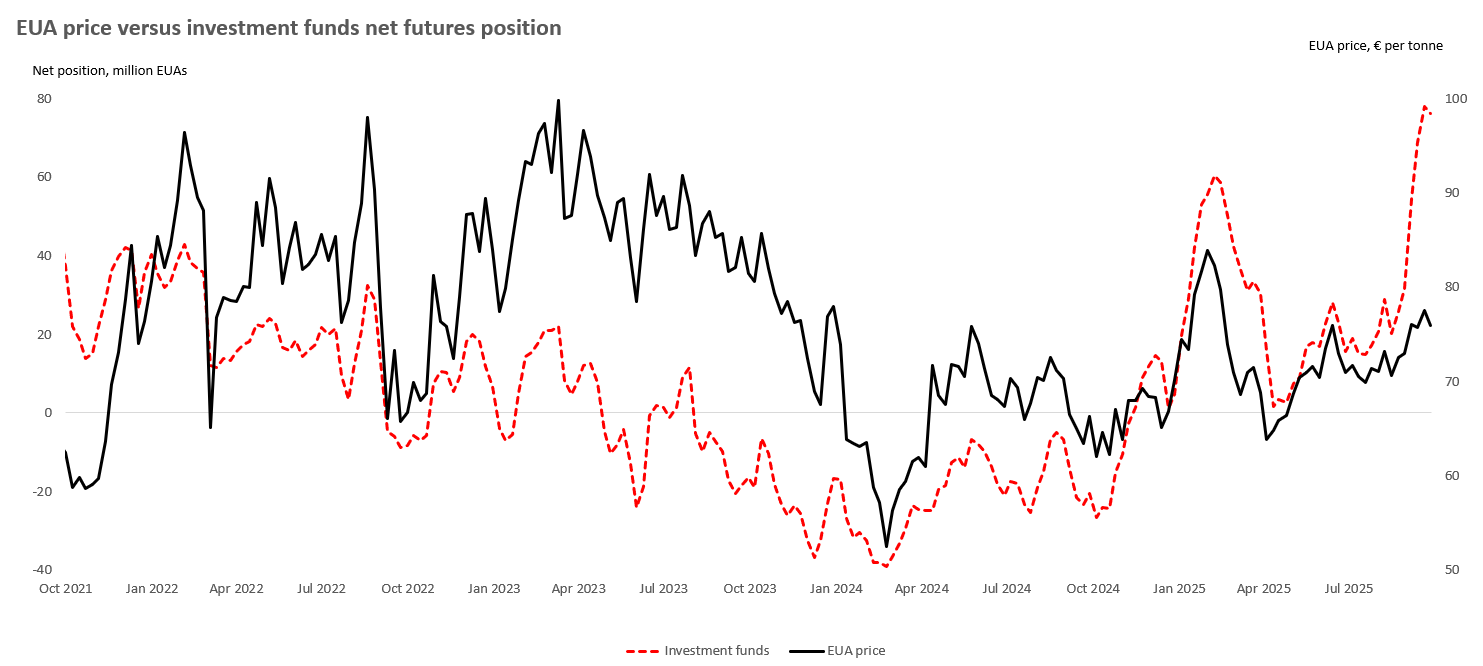
The latest Commitment of Traders (COT) report for w/e 26th September shows that investment funds now sit on a net long position of 76.2 million EUAs, down from the record 78 million EUAs seen in the previous week, and the first decline in six weeks. Up until w/e 19th September funds had been feverishly building net length in size for three consecutive weeks; +22.5 million EUAs in w/e 5th September, +14.7 million EUAs in w/e 12th September, and finally +9.2 million EUAs.*
As funds have positioned towards higher prices, so the EUA price has also jumped out of the €70-€75 range that the market had traded in since May, going on to hit a high of around €78 on 17th September. The last time this run of large consecutive weekly builds occurred was back in the summer of 2021. Back then the EUA price was trading around €55 and was only a few months away from making its first attempt at €100. At the time policymakers were busy discussing the Green Deal and the Fit-for-55 package and climate was the top concern among the voting public. A cost of living crisis and the emergence of populist ideology across Europe could barely be imagined.
The increase in the net position during the past month has coincided with the approaching end of September compliance deadline. This is only the second year when the compliance timetable has concluded in September, rather than the traditional date of 30th April. In September 2024 the EUA price dropped around 7%, belying concerns of a last minute rush for EUAs. The five month extension to the timetable in 2024 apparently giving compliance entities more time to pace their EUA purchases.
Any evidence of a late scramble for EUAs this year has been mixed. Auctions have tended to clear at a slight premium to the prevailing spot price, suggesting that demand for EUAs is robust. The cover ratio is another indicator of auction demand and measures the amount of bids received (in terms of EUAs), divided by the amount actually sold. In late September auction demand has been notably soft with last Thursday's auction registering the lowest cover ratio of any auction since March 2022.
*Many subscribers to Carbon Risk will already be very familiar with COT data, but for any of you that are new here and it's not something that you use very week, I've added a brief explainer at the bottom of this article, outlining everything you need to know.
Read the rest of this article with a 30-day free trial*
*and get access to the entire archive!